How to use neo4j for network diagrams and flowcharts
This is a work in progress and it looks like the current repo isn’t functional, although it was when I wrote this. Additionally, this should probably just be a gem..
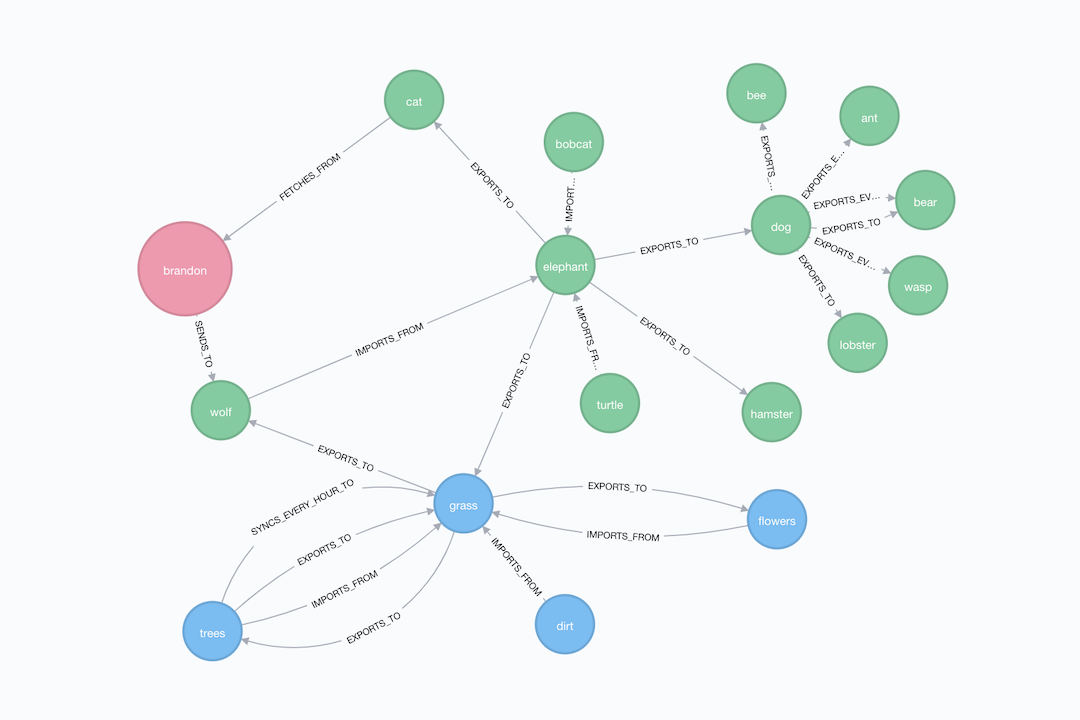
I’ve been hung up on the idea of using the neo4j console as a documentation tool for a while. I would google and google for an off-the-shelf product that had similar features, but the search always came up empty. Basically, I want to feed a piece of software markdown or .yml or something simple and have it spit out an interactive force-directed graph with zoom and filter features. I knew the neo4j had these features along with the Cypher query language which could be utilized to build more complete database queries, but for some reason, I always thought it may be a bit overkill.
Anyways, I decided to make it! In its current version, it is just a ruby script that utilizes the neo4j ruby gem to loop through and load a group of .yml “network” files, creating all the node labels, the nodes, and the labeled relationships for you. The code can use some cleaning up, but I’m really happy with the results so far. As output, you get a nice human-readable .yml file and a super-nice, human-readable network diagram or flowchart!
Here is the code to get started. Installation and setup instructions can be found in the readme. Feel free to open issues or PRs with issues, questions, comments, improvements, etc!